Keep track of key production indices over time using our newest feature - Season Indices
Take advantage of historical data to see the big picture of your vineyard’s trends on vine health, vegetation moisture, maturity growth and effective rainfall.
Amidst the increasingly variable climate conditions due to climate change, it is important to consider all data sources linked to sustainable production that is at our disposal. To this end, Deep Planet has developed the Season Indices feature, which gives users the opportunity to observe key indices such as NDVI, NDWI, Growing Degree Days (GDD) and cumulative rainfall over a multi-year time period in a consolidated platform on our web portal. This blog explores each index and its uses to help monitor current climate and production variables, and how to leverage historical data to your advantage.
NDVI - Normalised Difference Vegetation Index
The Normalised Difference Vegetation Index (NDVI) is a graphical indicator that assesses if the vegetation being observed is healthy or not. Using remote sensing, it quantifies vegetation by measuring the difference between near-infrared (which vegetation strongly reflects) and red light (which vegetation absorbs). NDVI helps to differentiate bare soil from crops or vegetation, detects plants under stress, and differentiates between crop stages, using an index between 0 and 1. The NDVI feature captures optical imagery at a spatial resolution of 10mx10m every 5 days allowing us to produce weekly NDVI maps of your vineyard (cloud cover permitting).

NDVI map of vineyards in California during the growing season on 12 July 2024, demonstrating vegetation health variability across blocks.
Deep Planet has access to archive satellite imagery that is used to display NDVI maps up to five years to date, meaning that the grower can compare vegetation health and vigour on a year-on-year basis. In the Season Indices tool, we convert this multi-year data into convenient graphs for the user to show the overall trends on the vineyard. Using this information, growers can better understand their plant vegetation health and vigour levels and make impactful decisions regarding canopy management such as shoot thinning, leaf removal, pruning and hedging, as well as manage fertiliser usage.

Graph showing NDVI block average on a multi-year graph, showing lower NDVI during the 2024 season compared to previous years.
2. NDWI - Normalised Difference Water Index
The Normalised Difference Water Index (NDWI) is used to measure the vegetation moisture condition of your farm. Similarly to NDVI, NDWI is derived using remote sensing to monitor changes related to water content which strongly absorb light in visible to infrared electromagnetic spectrum, using green and near infrared bands. NDWI uses images from Sentinel satellites to estimate NDWI at 10mx10m resolution every 5 days. NDWI is displayed as a colour spectrum map from -0.3 (very low) to 0.5 (very high) overlaid onto your vineyard - see example below.

NDWI map of vineyards in California during the growing season on 12 July 2024, demonstrating vegetation moisture variability across blocks.
Similarly to NDVI, Deep Planet has access to archive satellite imagery that is used to display NDWI maps up to five years to date, meaning that the grower can compare vegetation moisture and plant water content on a year-on-year basis. In the Season Indices tool, we convert this multi-year data into convenient graphs for the user to show the overall trends on the vineyard. Using this information, growers can better understand their plant water stress levels and make impactful decisions such as irrigation management or covering soil surface to reduce evaporation.

Graph showing NDWI block average on a multi-year graph, showing moderate NDWI during the 2024 season compared to previous years.
3. Growing Degree Days (GDD)
Growing degree days is a weather-based calculation widely applied in predicting the phenology in crop production, and frequently used by growers as a measure of heat accumulation in order to track crop development and predict the date that a crop reaches maturity. Daily growing degree day values are added up from the beginning of the season, providing an indication of the energy available for plant growth. Growing degree day totals are used for comparing the progress of a growing season to the long-term average and are useful for estimating crop development stages and maturity dates.
The calculation of GDD is the cumulative sum of Growing Degrees (GDs), which is defined as the mean daily temperature (average of daily maximum and minimum temperatures) above a certain threshold base temperature accumulated on a daily basis over a period of time. Negative values, meaning temperatures below the threshold, are treated as zeros and ignored. The base temperature varies among crops and the value is derived from the growth habits of each specific crop. The base temperature is that temperature below which plant growth is zero. In our case, we set the threshold base temperature at 10 degrees Celsius, or 50 degrees Fahrenheit, during the growing season period between 1 April and 20 November in the northern hemisphere, and between 1 August and 20 April in the southern hemisphere.
Currently, the portal displays GDD in Celsius GDs, with the Fahrenheit GDs functionality to be added very soon.
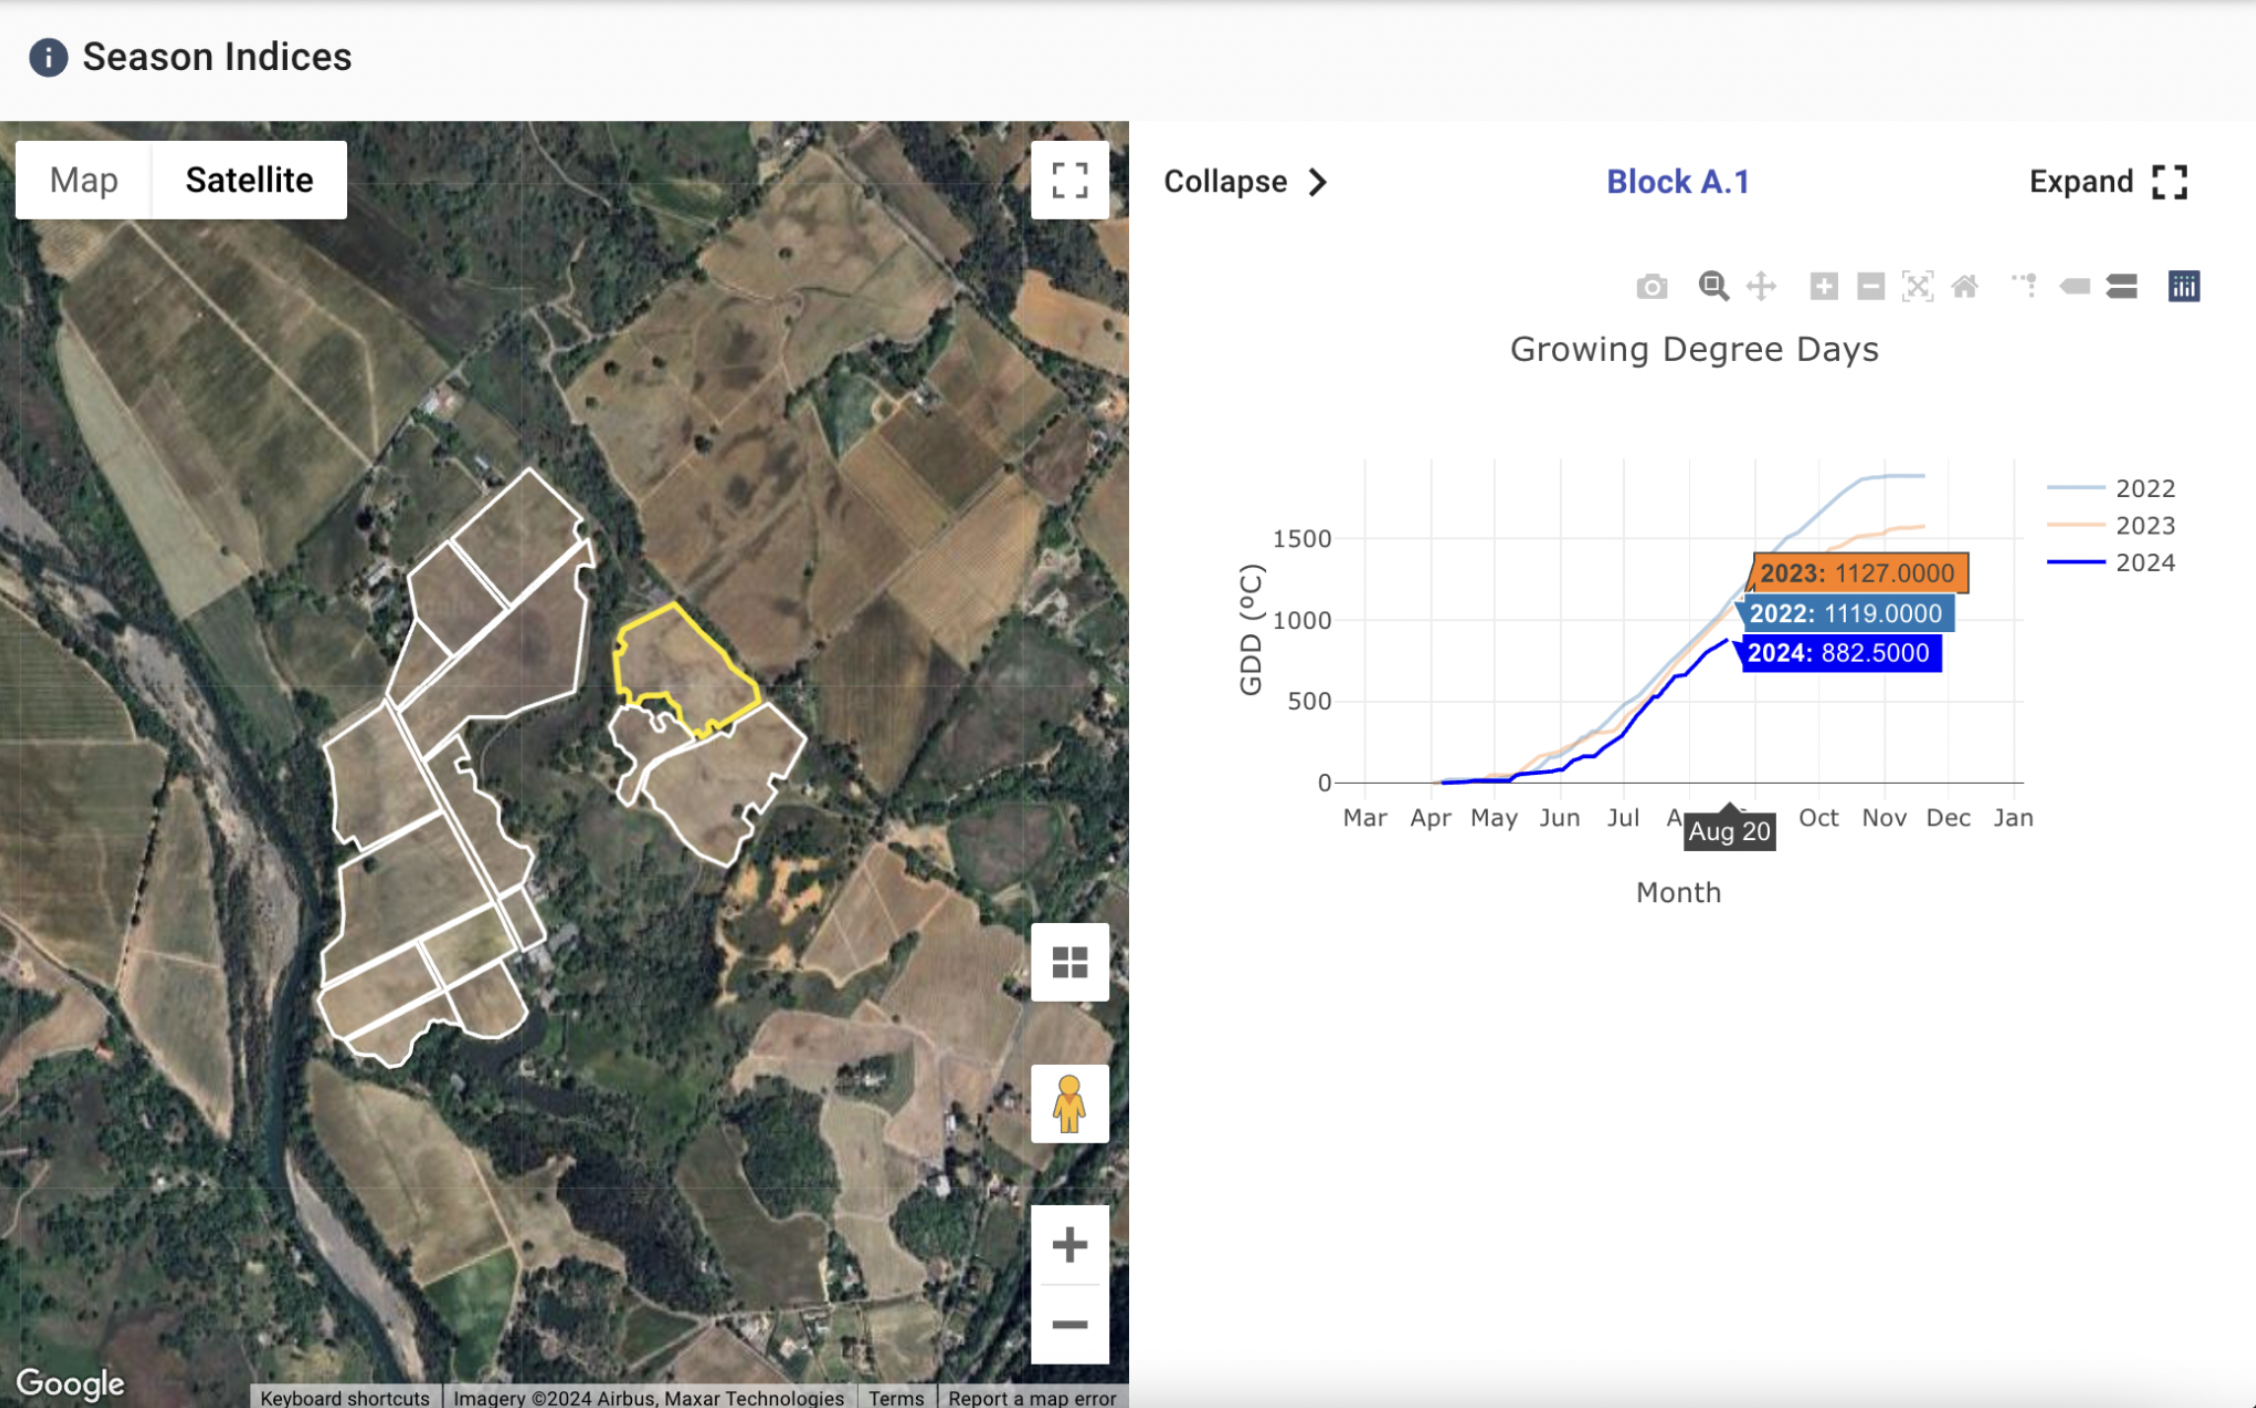
Graph showing GDD block average on a multi-year graph, showing slower GDD accumulation throughout the current season compared to previous years, particularly during the late spring and early summer in May and June.
4. Cumulative rainfall
Total amount of rainwater matters greatly to plant health and crop development, dictating important management decisions such as irrigation requirements, nutrient inputs, and overall water availability. A vital and increasingly scarce resource, cumulative rainfall helps a grower to understand potential crop yields and yield quality. However, too much rain has been observed to cause counterproductive effects such as higher disease prevalence, excess plant vigour, or sugar content dilution later in the season during the harvest period. Using this information, growers can better understand their plant water stress levels due to rainfall shortage and make impactful decisions such as irrigation management, evaporation prevention, disease treatment, or promote surface drainage.
Deep Planet has access to historical cumulative rainfall data, which the user can compare on a year-on-year basis. In the Season Indices tool, we convert this multi-year data into convenient graphs for the user to show the overall trends on the vineyard. The graphs display cumulative rainfall data in both cm/mm and inches/feet to cater to regional measurement differences.

Graph showing cumulative rainfall block average on a multi-year graph, showing increased rainfall throughout the current season compared to previous years, particularly during spring in April and May. Higher disease prevalence has been observed in these months.
Final Thoughts
Satellite imagery and climate data over a period of time gives us the ability to consider the big picture of climate trends and tendencies that affect crop production and agricultural management. With the benefit of remote sensing technologies, these historical data points for key climate indicators can demonstrate valuable insights for sustainable and efficient crop management.
If you have any other indices that you wish to see on the platform, please let us know, we would love to hear from you.
To learn more about Deep Planet’s VineSignal platform, please visit our website or contact hello@deepplanet.ai for more information or to arrange a demo.