
How to identify and map agricultural fields using high-resolution satellite imagery?
The development of AI and agricultural technologies in general has enabled farmers and policy makers to monitor their fields online with satellite imagery. But how would one develop an AI algorithm if the data on the crops you are interested in is not available? There are two ways to do this: either to use existing out-of-the box algorithms and fine-tune them on your specific crop or to develop a new algorithm from scratch. However, for both of these tasks you will need to prepare a database that has some fields of the crop you are interested in, in the region you are interested in.
We have extensive experience in crop mapping, crop type mapping and boundary delineation tasks using Sentinel-2 satellite imagery (1). We are sharing our experience on data preparation in our new paper “Methodological approaches to identifying and mapping fields of specific crops on a basis of high-resolution satellite images using phenological, geographic, and regional statistical information”. In this paper, we describe advanced techniques for crop mapping using satellite data and qualitative information. These approaches involve interpreting features in satellite images together with cartographic, statistical, and climatic data. The study focuses on data collection and mapping of three specific crops: lavender, almond, and barley, and relies on various sources of information for crop detection, including satellite image characteristics, regional statistical data detailing crop areas, and phenological information. We share the datasets for these crops that we have assembled online: https://zenodo.org/records/10675289 .
In addition to agricultural crops, we are already actively using the proposed method to detect vineyards, provide regional vineyard detection scans for grower associations globally and identify a range of other horticultural objects. Ultimately, we aim to apply and test our approaches across all the world's most important agricultural regions and we will be releasing step-by-step instructions on how to prepare the data and to run these algorithms soon!
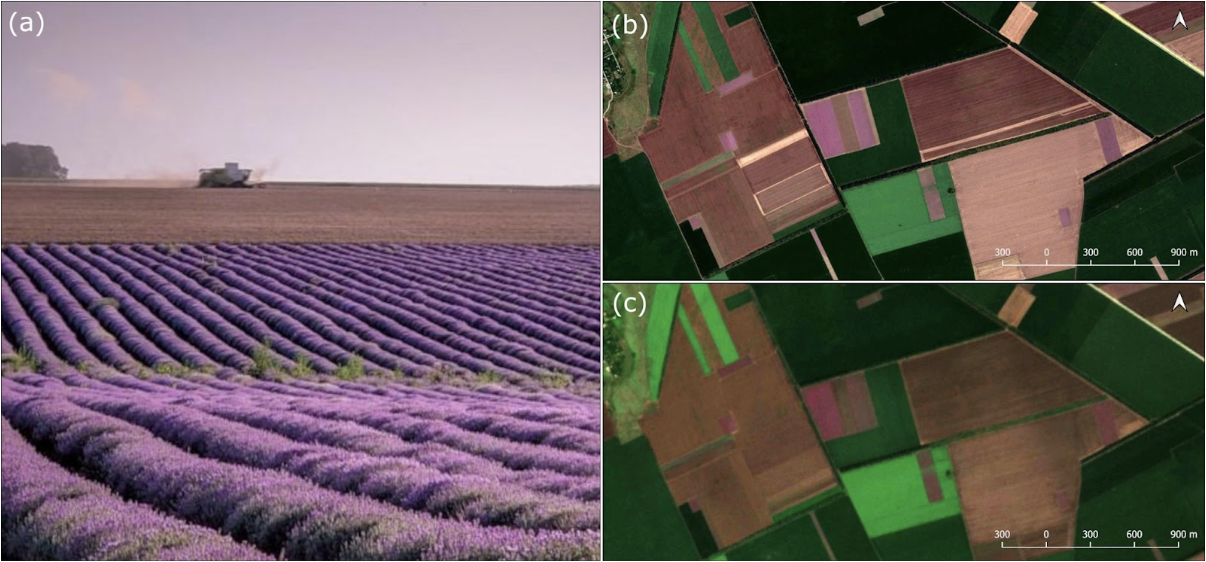
Figure 1. (a) Lavender field, Provence, France. Photo: Anton Gvozdikov, Google Earth, (b) lavender fields (dark-gray colour), Provence, France. Google Earth. 03.05.2016, (c) lavender fields (purple colour), Provence, France. Sentinel-2 image, true colours. 03.07.2020.
Additionally, we test several state-of-the-art semantic segmentation methods to assess the suitability of the proposed method for gathering data for advanced AI algorithms (the code for the best model is available on github: https://github.com/burantiar/EDS_segmentation). The data and methodology, presented in this paper, can be used for a variety of tasks, such as collecting fine-grained data for training small and medium-scale ML models, including all types of semantic segmentation tasks, and for fine-tuning large geospatial foundation models.
In future work, we will explore how to use this data with foundation models to fine-tune their performance on our data.
Read the full paper by our Head of GIS Alexey Unagaev via the following link: https://doi.org/10.1017/eds.2024.23
(1) Crop mapping involves binary classification of each pixel as either crop or non-crop. Crop type mapping requires multi-class classification or one-versus-all binary classification. Field boundary delineation involves detecting only field boundaries for agricultural fields or different vegetation types.